Debugging node.js in Cloud9 IDE
In this article I’ll be sharing some of my level-up experience learning how to debug node.js apps. It was not easy at first, but once I got it, I felt empowered that now I can work with any code base.
Debugging is useful for solving vague problems in other people’s code and it’s also useful for learning how something actually works. The article might be particularly useful for those used to having debugger experience in WebStorm or similar IDEs.
Quick reference
That article is meant to be more like a cheat sheet rather than too detailed step by step guide, here’s a go-to list of techniques:
Node debugger
Let’s start by the basics — using the node’s native debugger.
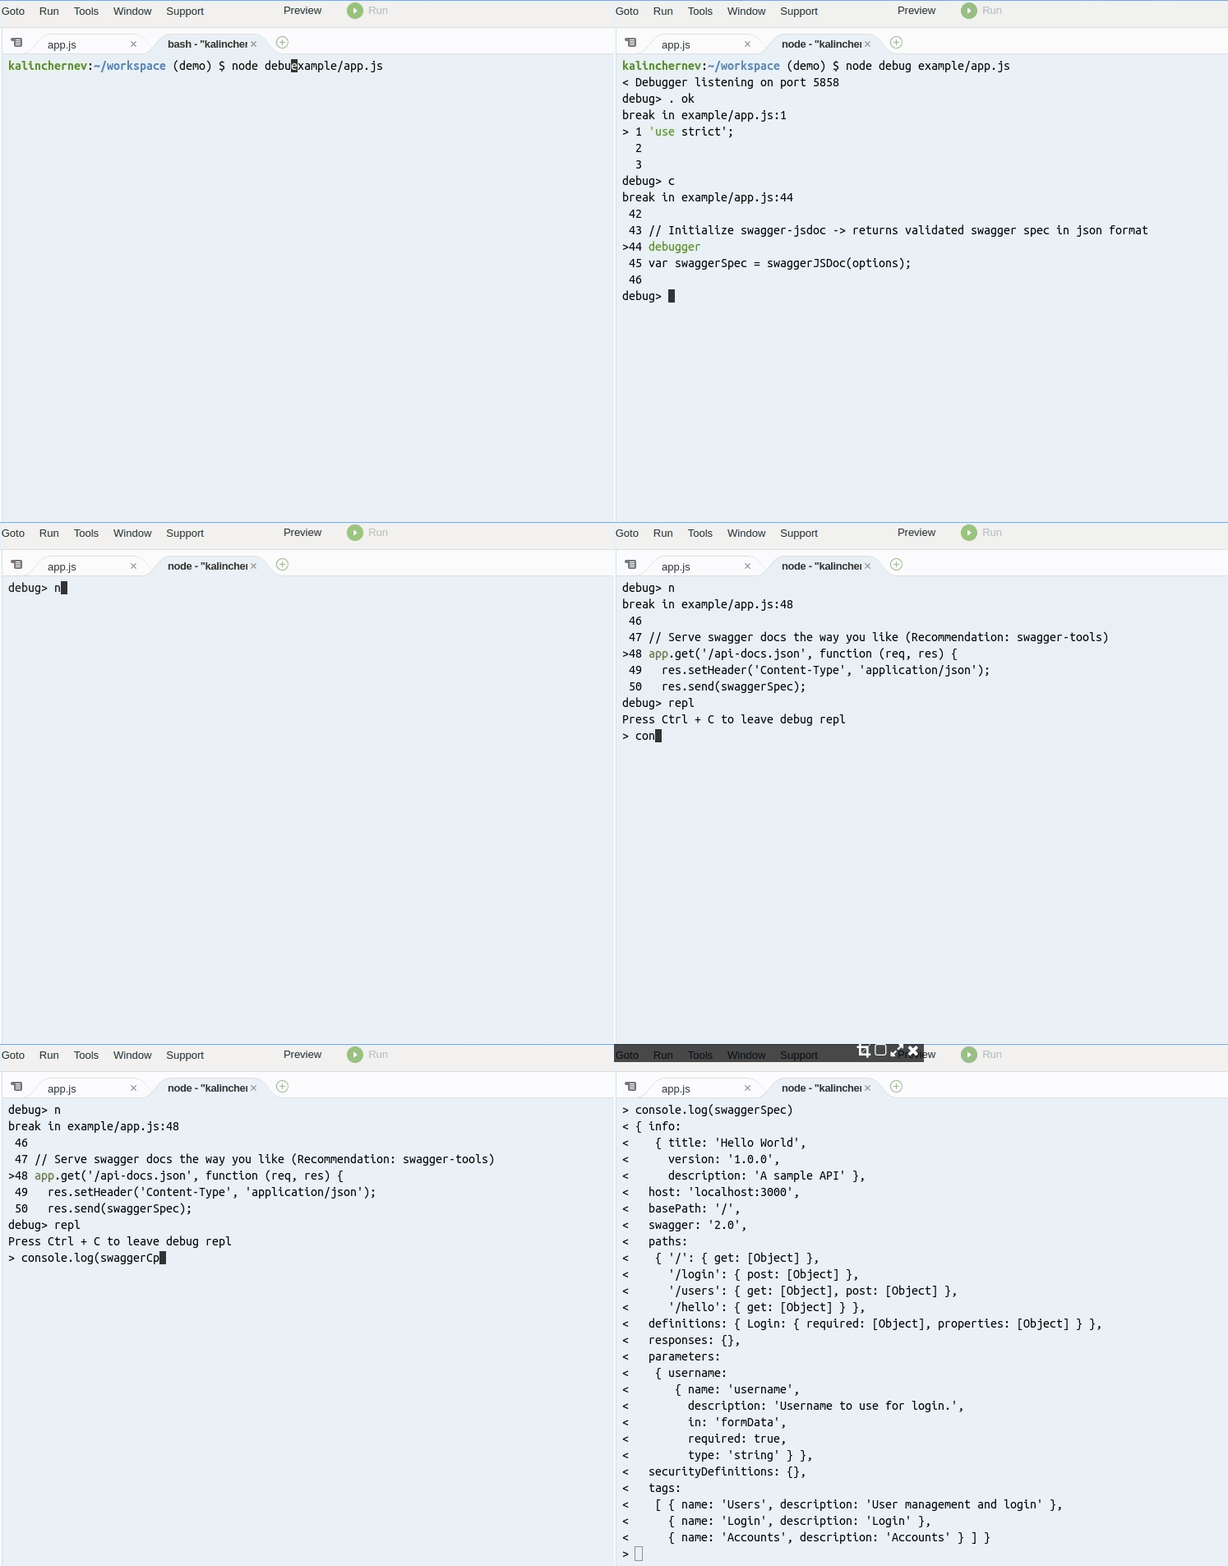
For example, this app contains a simple server returning a JSON object which is a swagger specification and I need to debug and see its value. So, in this example, I’ll follow this steps to see the contents of the variable:
- Set a break point with
debugger - Run the script with
node debug example/app.js - Work with the controls of the debugger to reach a good value:
cto continue andnfor next - Use
replto execute some code which access current state of the system
Simple script
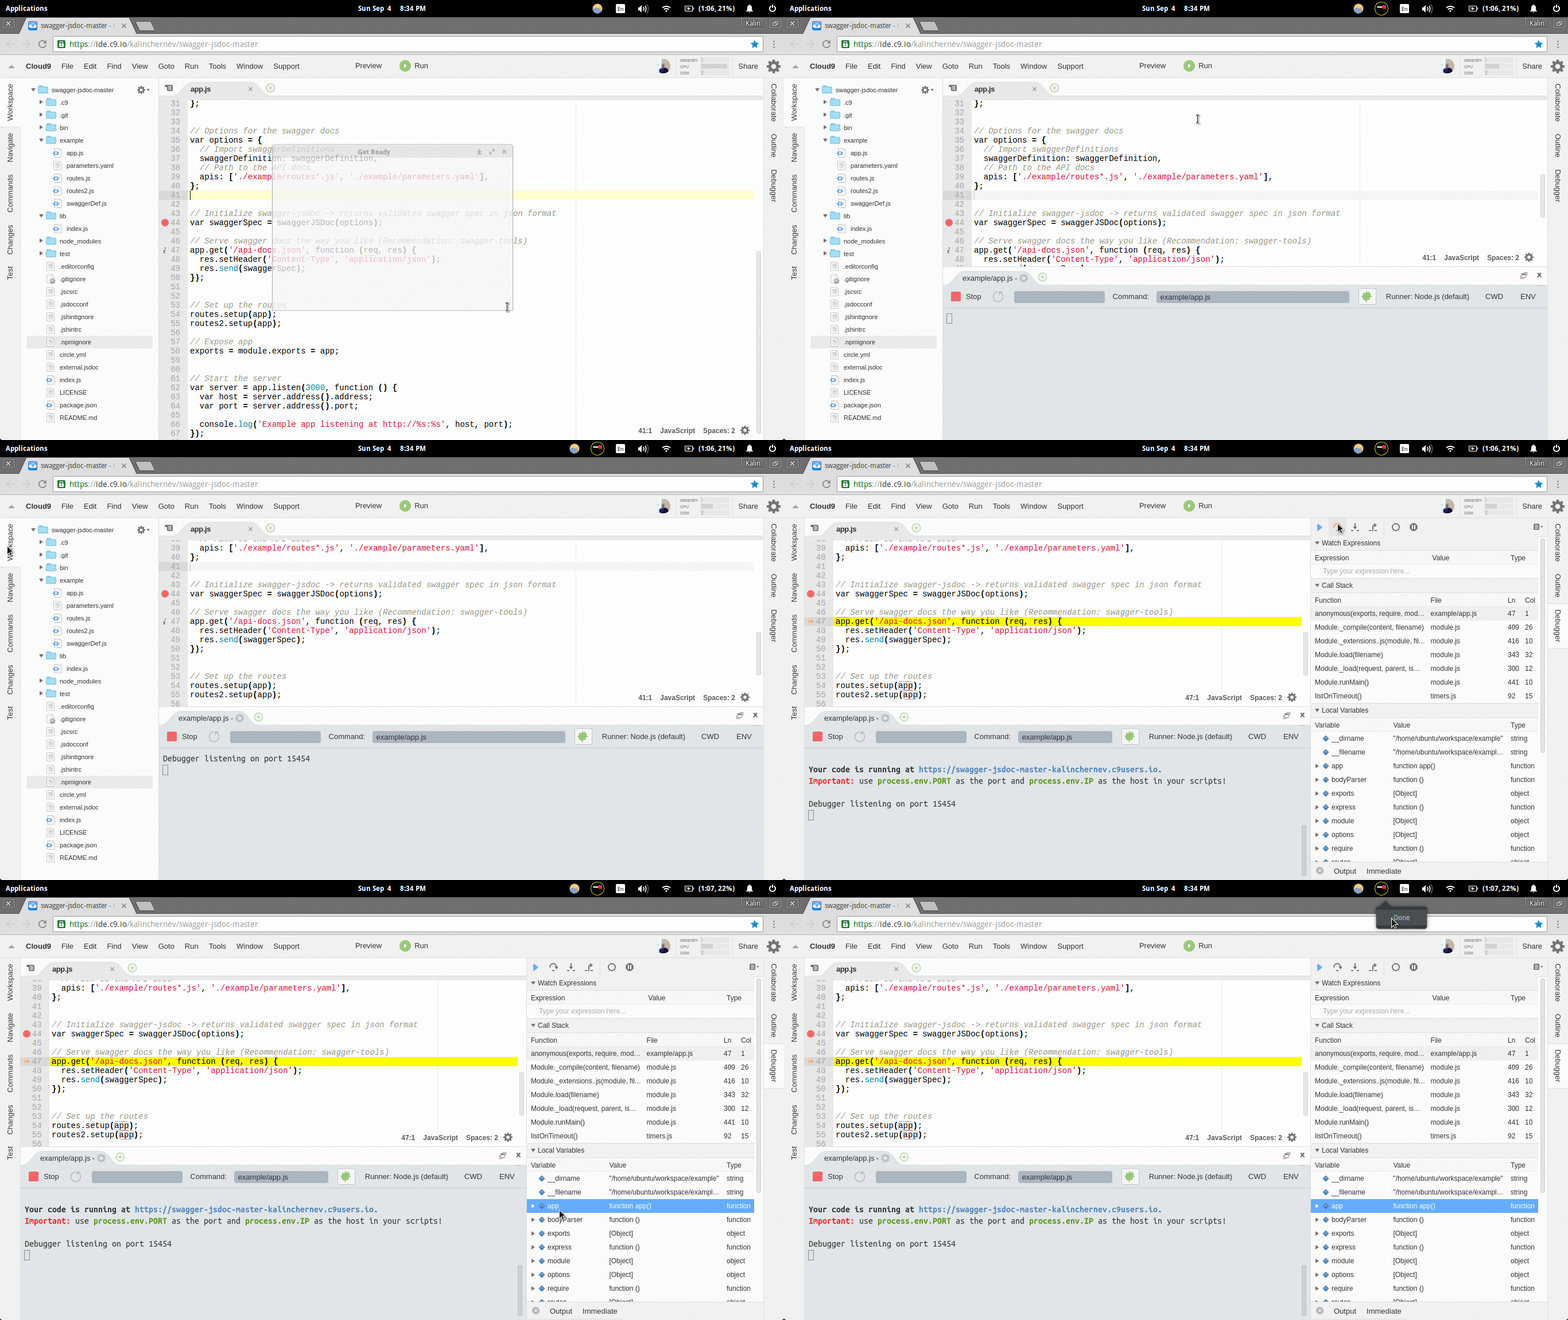
- Add a break point
- Press the Run button to execute the default node runner (ensure the debugger is enabled — more info)
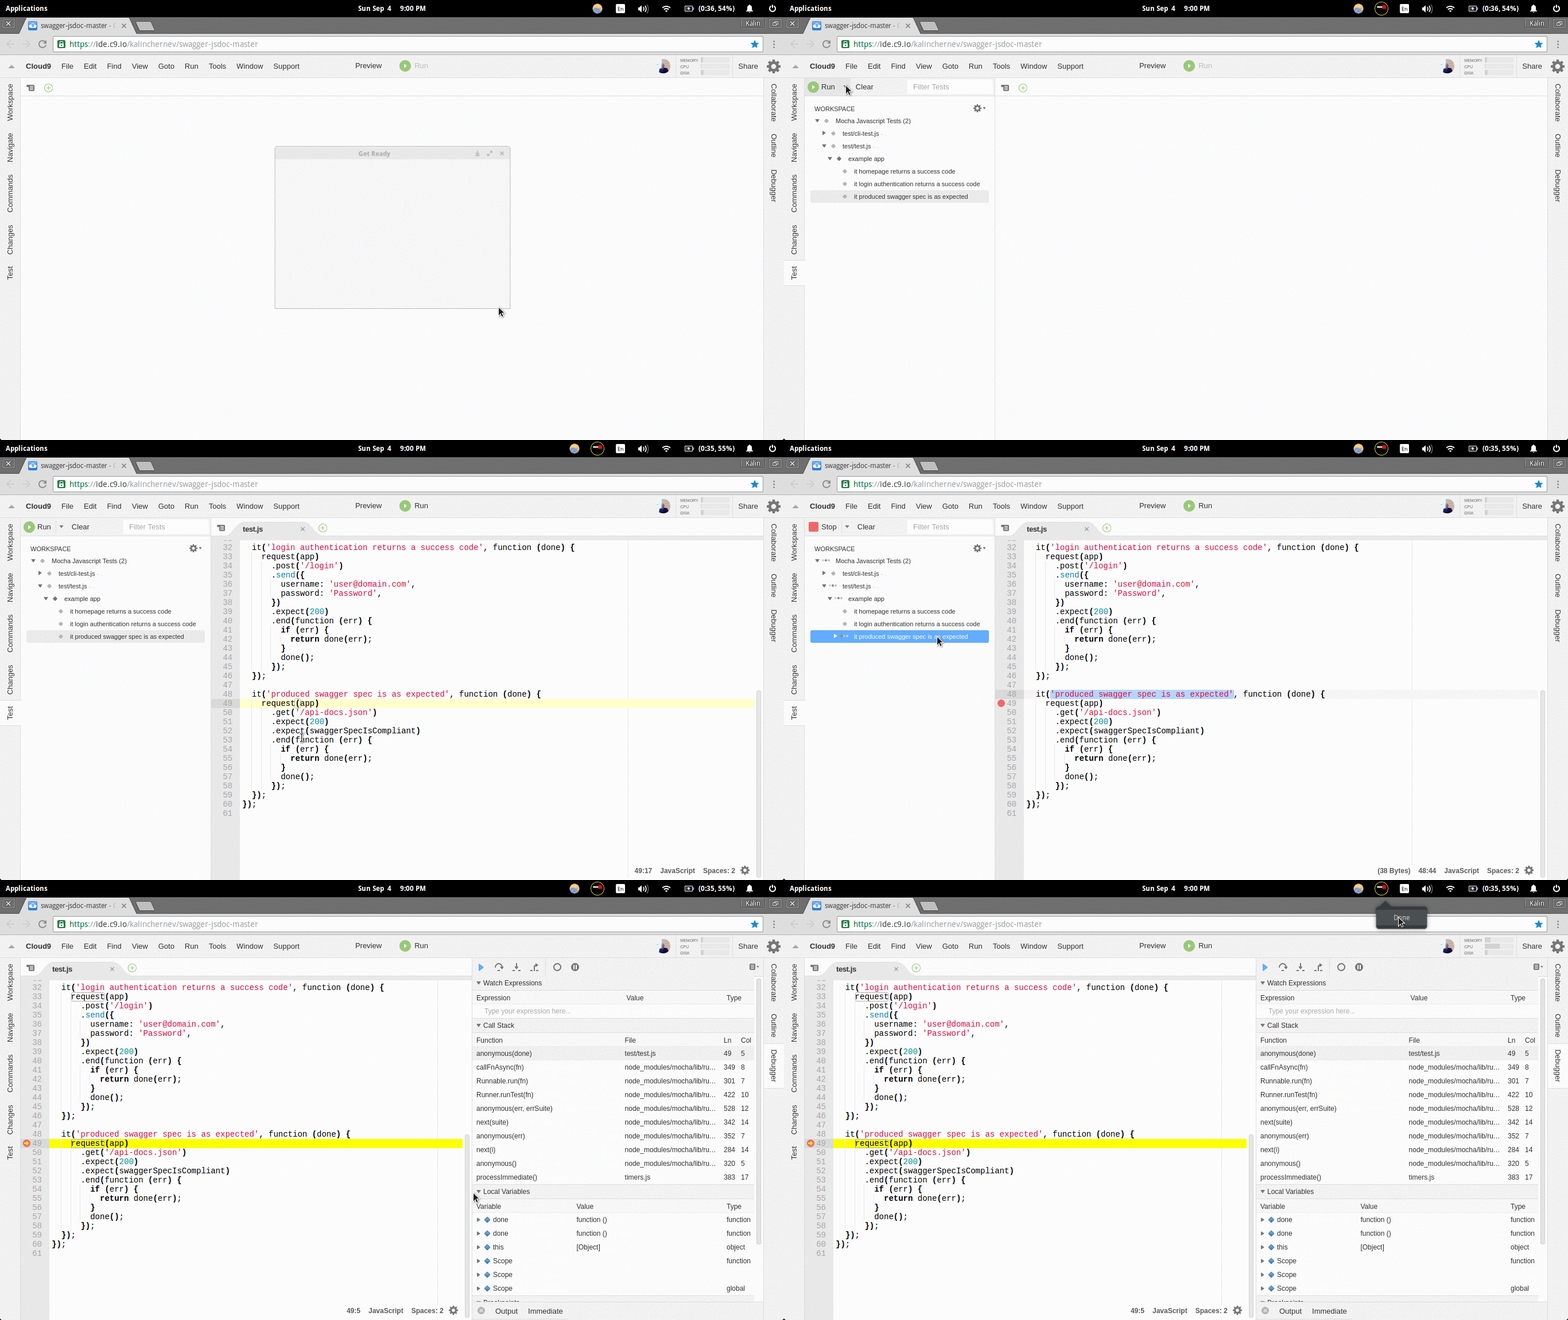
Mocha tests
This is an experimental feature.
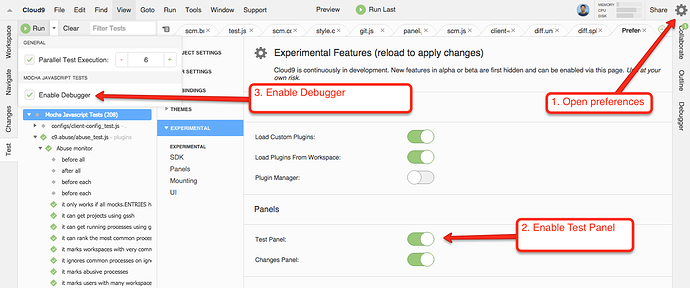
- Enable ‘Tests” from the editor settings
- Refresh the page and see the panel
- Put a break point in the test
- Enable debugging in the “Test” panel
- Run the test suite or scenario
This feature actually worked for me, I felt just the same way when I made my first animality in MK3.
Command-line apps
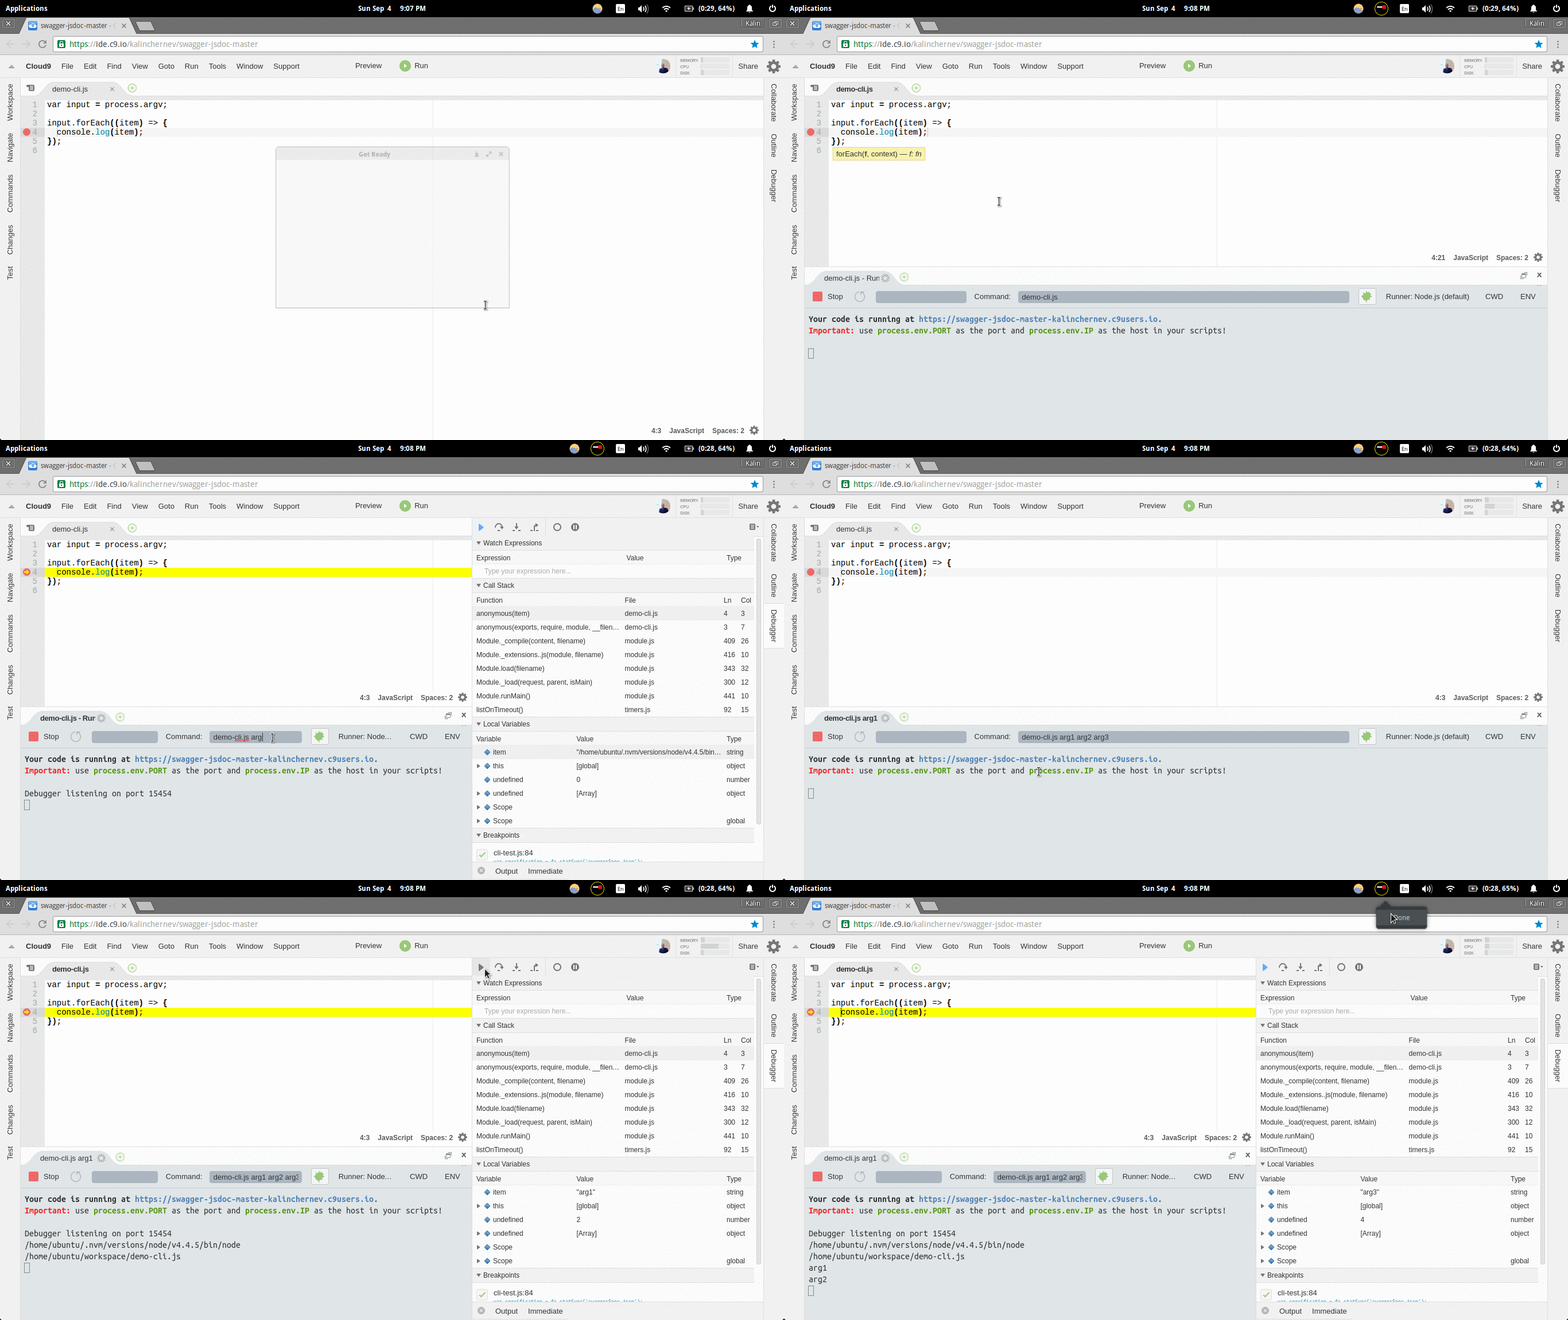
In fact it’s almost identical to debugging a simple script, the only detail you have to notice is an input box where you put the actual command as if ran in the command line.
- Open the command-line app and place a break point
- Use the Run menu to start the process in debug more
- Change the input process name and restart the runner